
Change Impact Assessment Part 1


A common problem in large programs or projects is that the impact of change cannot be fully determined or estimated early in the initiative. Detailed process and/or workflow changes still need to be identified. Potential technology solutions need to be assessed. Job roles may change and new roles may be added, which makes it extremely difficult to make an early assessment of the potential change impact on workgroups and individuals.
This article is the first of a two-part series looking at a method employed to provide a systematic way of assessing the degree of change impact across project workstreams, departments, workgroups, etc. In Part 1, we will look at the business need and describe the approach. In Part 2, we will describe how the gathered data were analyzed and discuss the results that were generated.
A major corporation was implementing a large-scale program to improve the throughput of work and make it economically scalable for higher volumes of work in the future. The vision of the program encompassed two major efforts. The first was to establish a much higher degree of automated transaction processing that included capturing and updating data automatically. The second, and larger component of the program, was to use the data captured to evaluate transactions against business rules for workflow routing and to assess the potential for errors, fraud, missing data, etc.
As envisioned, there were not to be any major reorganizations. However, workflows would change, and new, sophisticated technology would be implemented. Senior management wanted a high-level view of how deeply specific departments and functional workgroups would be impacted. There were concerns about on-going operations during the transition. Also, many of the changes envisioned could not be easily implemented in phases. They had to go into production in a “throw the switch” changeover.
These changes affected multiple departments in different ways since many workflows crossed departments and specialty workgroups. There was also an issue for departments that were affected by multiple workflows since they could be subject to overlapping and repeated changes.
To model the overall impact, we used the Process, Technology, and People change triangle. The basis for the model was that the length of the sides of the triangle could be used as a measure of the magnitude of the change. The angle between the Process and Technology sides could measure how closely related those two components were. Closely related Process and Technology changes were assumed to be harmonized and have less impact on People. This is depicted in the diagram below:
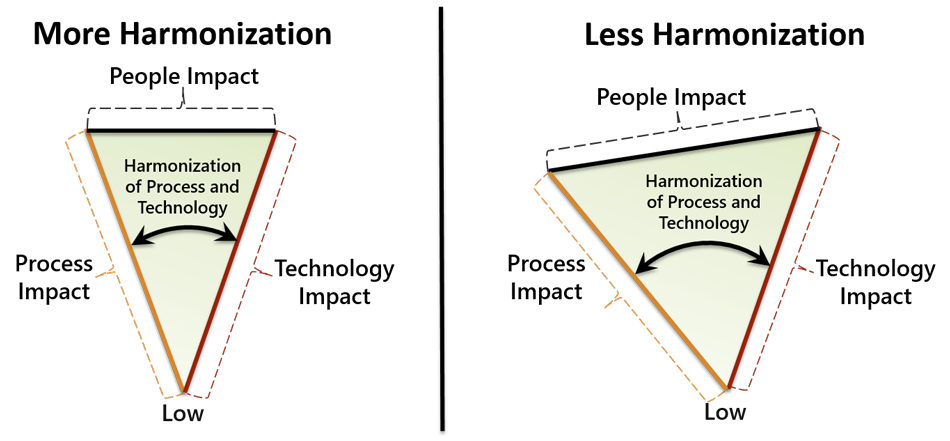
Each of the two scenarios above have the same relative amount of Process and Technology impact. However, the right-hand scenario has less harmonization between Process and Technology and therefore more relative people impact. The area inside the triangles was used as a relative measure of the total change impact.
The challenge was to assemble the data for each workflow, by department and/or workgroup, before any formal design was completed. The approach to gather the data was a three-step process. First, informed predictions would be developed to estimate how the current processes would change. Then, expert assessments would be gathered to forecast how technology could be applied to the anticipated process changes. Lastly, both assessments would be harmonized to determine how they intersected, and how one might complement the other. The assumption was that process and technology changes that are closely related could be assimilated more easily than those less related.
A cross-functional team of subject matter experts (SMEs) for each workflow was formed from the impacted departments and workgroups. Many of the SMEs participated in multiple sessions since their department or workgroup handled multiple workflows. All SMEs were provided an overview session to paint a clear picture of the overall program vision and to set a common understanding of how the business would be able to quickly scale to new higher levels of transactions.
The first round of facilitated sessions addressed the processes for each workflow. The SMEs were asked to envision what process changes would look like, but only at a very high level. Many specific details were identified and, as they arose, they were captured for subsequent detailed discussions. The objective was to visualize the overall high-level workflow processes. The SMEs were then led through facilitated discussions to make an assessment of how much impact the new process had on their specific departments. Each department was required to agree on a numeric score from one to ten. With one being virtually no impact and ten being dramatic and disruptive change.
The second round of sessions were designed to make the same type of assessment of technology impact. The SMEs were joined by technology experts to discuss the process changes and what technologies might support them. The technology experts convened separately to develop potential solutions. Both groups reconvened to evaluate the proposed technology changes. Each department, with the technology experts input, provided a second numeric score for the estimated impact of technology on their department for that workflow.
The third round of sessions focused on how process changes and technology complimented one another. The SMEs had direct input from the technology experts. The group could explore in more detail as necessary to assess how they thought the changes in process and technology would harmonize. Each department was asked for a different metric at the end of this session. This time they were give a numeric table of values to choose from and assign a score, as shown below:
Degree of Harmonization |
Score |
|---|---|
| High | 15 |
| Medium High | 30 |
| Medium | 45 |
| Medium Low | 60 |
| Low | 75 |
| None | 90 |
At the end of the sessions, the data were compiled for each workflow and impacted department/workgroup. Tabulated scores for each workflow and department were prepared as shown in the sample data table below:
Workflow # |
Department |
Harmonization Score |
Process Impact |
Technology Impact |
|---|---|---|---|---|
| 1 | A | 45 | 4 | 7 |
| 1 | C | 60 | 5 | 8 |
| 1 | D | 30 | 4 | 8 |
| 2 | B | 45 | 3 | 6 |
| 2 | D | 60 | 4 | 5 |
| 3 | A | 15 | 8 | 6 |
| 3 | B | 45 | 6 | 7 |
| 3 | E | 30 | 6 | 8 |
| 4 | B | 75 | 7 | 5 |
| 4 | C | 60 | 7 | 4 |
| 4 | E | 45 | 6 | 4 |
With the process and technology impact estimates and the harmonization assessments completed, the people impact and total impact assessment estimates could be prepared. In Part 2, we will go into detail about how those were developed and how the results were presented and used.
Read Part 2 now